Math 1010
Reflective Writing
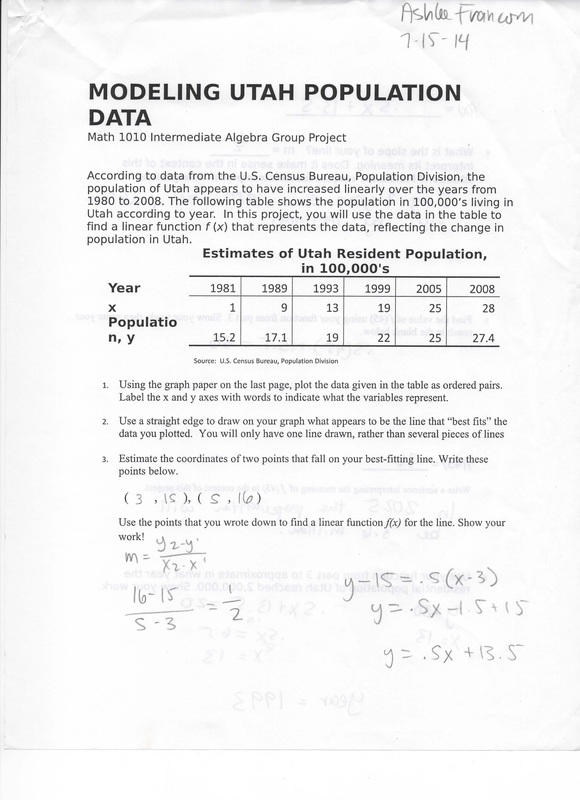
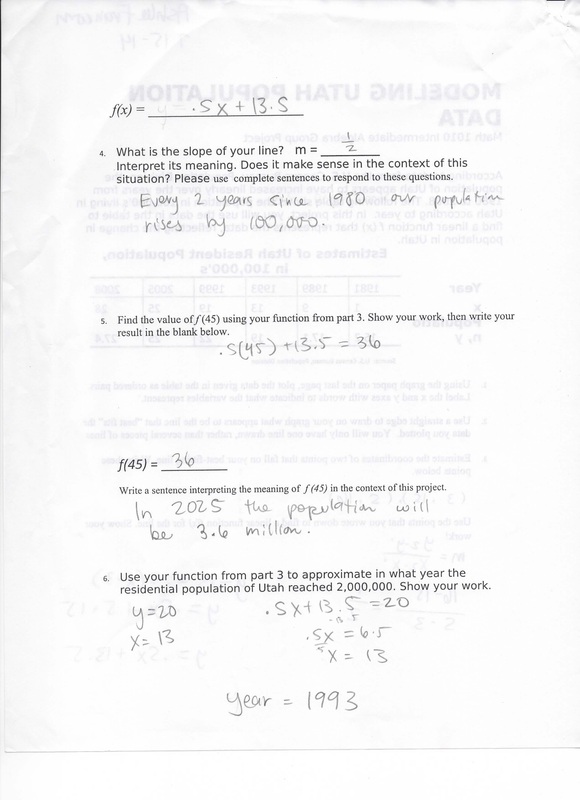
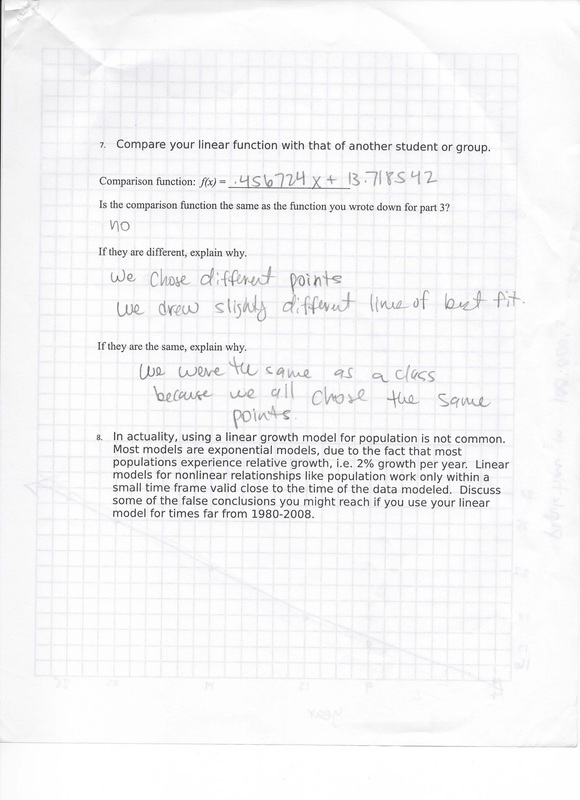
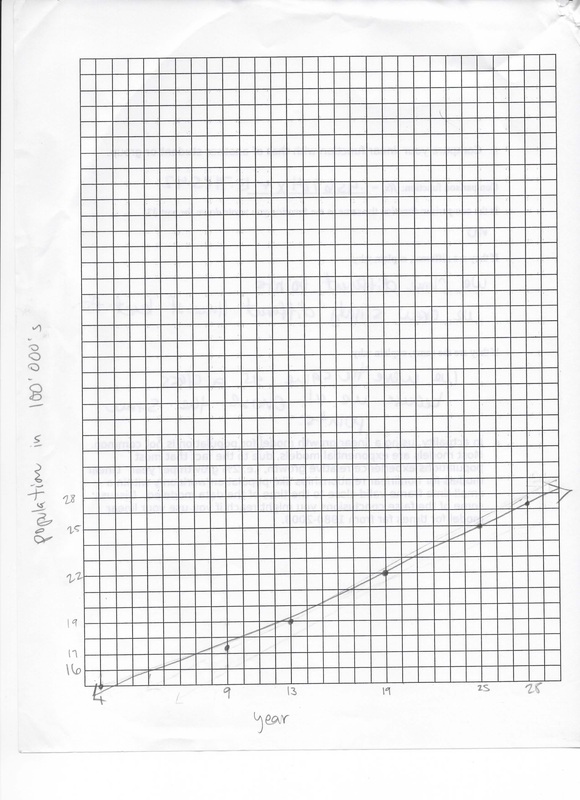
For the project for Math 1010 we as the students were to demonstrate the use of a function to estimate the amount of time it would take for the population of the State of Utah to increase depending on the variables given. We also used the rule of the line that best fits when we were asked to draw a straight line through some plotted points that did not necessarily fit together in a straight line. Once I drew my line I was asked to create a function based on the line drawn. I was able to deduce that my function was different than the function that the author of the assignment used. This taught me that using functions to project population growth was purely an estimate, and by this we could gain some false conclusions. My thought was confirmed when I was to compare my function with that of another student in class. They created their function based on the different points that were given in the original data. This gave them a different estimate of growth for population, showing me that I had been using a function that gives estimates of a lower population growth.
In conclusion, I would say that the use of exponential models would probably be a better way to conclude population factors because they take more data in to account for why certain areas tend to see more growth. We could also see more accurate data if we were to divide the state into counties, and use exponential models based on the growth in each county, and then combine all of them to see the total population for the State of Utah.
The best part about this project was that I learned that it isn’t hard to use math in this practical kind of way. Normally I am the first person to opt out of doing math, but as I use math in various practical ways I realize “I can do this! “ I am going to store this information in the important file in my brain because it just might come in handy as I start my career one day.
Reflective Writing
For the project for Math 1010 we as the students were to demonstrate the use of a function to estimate the amount of time it would take for the population of the State of Utah to increase depending on the variables given. We also used the rule of the line that best fits when we were asked to draw a straight line through some plotted points that did not necessarily fit together in a straight line. Once I drew my line I was asked to create a function based on the line drawn. I was able to deduce that my function was different than the function that the author of the assignment used. This taught me that using functions to project population growth was purely an estimate, and by this we could gain some false conclusions. My thought was confirmed when I was to compare my function with that of another student in class. They created their function based on the different points that were given in the original data. This gave them a different estimate of growth for population, showing me that I had been using a function that gives estimates of a lower population growth.
In conclusion, I would say that the use of exponential models would probably be a better way to conclude population factors because they take more data in to account for why certain areas tend to see more growth. We could also see more accurate data if we were to divide the state into counties, and use exponential models based on the growth in each county, and then combine all of them to see the total population for the State of Utah.
The best part about this project was that I learned that it isn’t hard to use math in this practical kind of way. Normally I am the first person to opt out of doing math, but as I use math in various practical ways I realize “I can do this! “ I am going to store this information in the important file in my brain because it just might come in handy as I start my career one day.
Utah Population Project
|
|
|
|
